

The Science Panel
The Science panel is a dock along the bottom of the map. What it shows depends on how the room’s owner set it up:
- A Science configuration lets you pick a point: click the map, and the panel charts the room’s data at that spot. For example, a drought index year by year under three climate scenarios, against the mean of a reference period. See Pick a point.
- A science dataset, in practice the one in the public room, brings together a species map and the dead trees detected in each yearly flight, and adds them up per zone: cantons, districts, or forest ecoregions. See Explore zones.
Open the panel
Section titled “Open the panel”Click the flask icon — Science panel — in the map toolbar (by default at the top, beside the search box). Click it again, or the ✕ at the right end of the panel, to close it.

The panel opens along the bottom of the map. While it is open, the map’s own controls — zoom, legend, base map, and the rest — move up to stay clear of it.
Pick a point
Section titled “Pick a point”In a room with a Science configuration, opening the panel starts picking. The cursor becomes a crosshair, and a banner reads Click the map to read the values there · Esc to stop. Click the map: the panel reads the layers of the current view at that spot, and the map outlines the cell the values come from. Every click inside that outline gives the same values.
While you are picking, a click on the map reads values: it does not open a feature’s popup or a raster’s comments. To stop, press Escape, click the ✕ on the banner, or click Stop picking in the panel’s header. The panel keeps the last point, and Pick a point starts again. Closing the panel stops picking too.
The dock
Section titled “The dock”- The header holds the views the room offers, as tabs (for example Year by year, Period
means, June–October). Next to them:
- the Measure menu;
- a menu for each choice the view asks for, such as the period a month profile shows;
- Difference to the reference;
- Pick a point, Show the table and How to read.
- The left column gives the picked Point (its coordinates), the size of its cell (for example 250 m cell), the unit, and the values of every series at the year or month under your pointer.
- The chart fills the rest.
- The legend along the bottom names each series with its colour and dash, and the reference.
Charts
Section titled “Charts”- Along years or months: one line per series, for example one per climate scenario. A gap is a missing value, never a zero. The reference is a dashed line: a level line for a single value, such as the 1981–2010 mean, or a dashed series along the same axis, such as the reference month profile. Hover over the chart, or move along it with the arrow keys, to read every series at one year or month.
- Compared: grouped bars, for example one group per period with a bar per scenario.
- Difference to the reference shows each value minus the reference: above zero is more than the reference. A value without a reference to compare with becomes a gap, never the raw value.
Show the table swaps the chart for a table of the same figures: one row per year, month or category, one column per series and the reference. Copy as CSV copies it.
What a value means
Section titled “What a value means”The values are those of the stored cell under the point. Nothing is interpolated: the outline on the map shows the cell, and its size is in the left column.
- No data at this point. The data holds no value in this cell for this view, for example a forest index outside the forest. It is not a zero.
- This point is outside the data. The point lies beyond the edge of every layer of the view.
- Preparing the data for this point… The first time a layer is read after a while, the server fetches it first. The panel asks again by itself.
- None of this view’s layers is in the room. The configuration names layers the room no longer has. Its owner can see which ones in Room settings.
How to read opens the configuration’s own explanation in your language, followed by its sources. Each source lists the room layer it reads and its bands (for example 80 bands, 2020–2099), or says that no layer with that name is in the room.
Explore zones
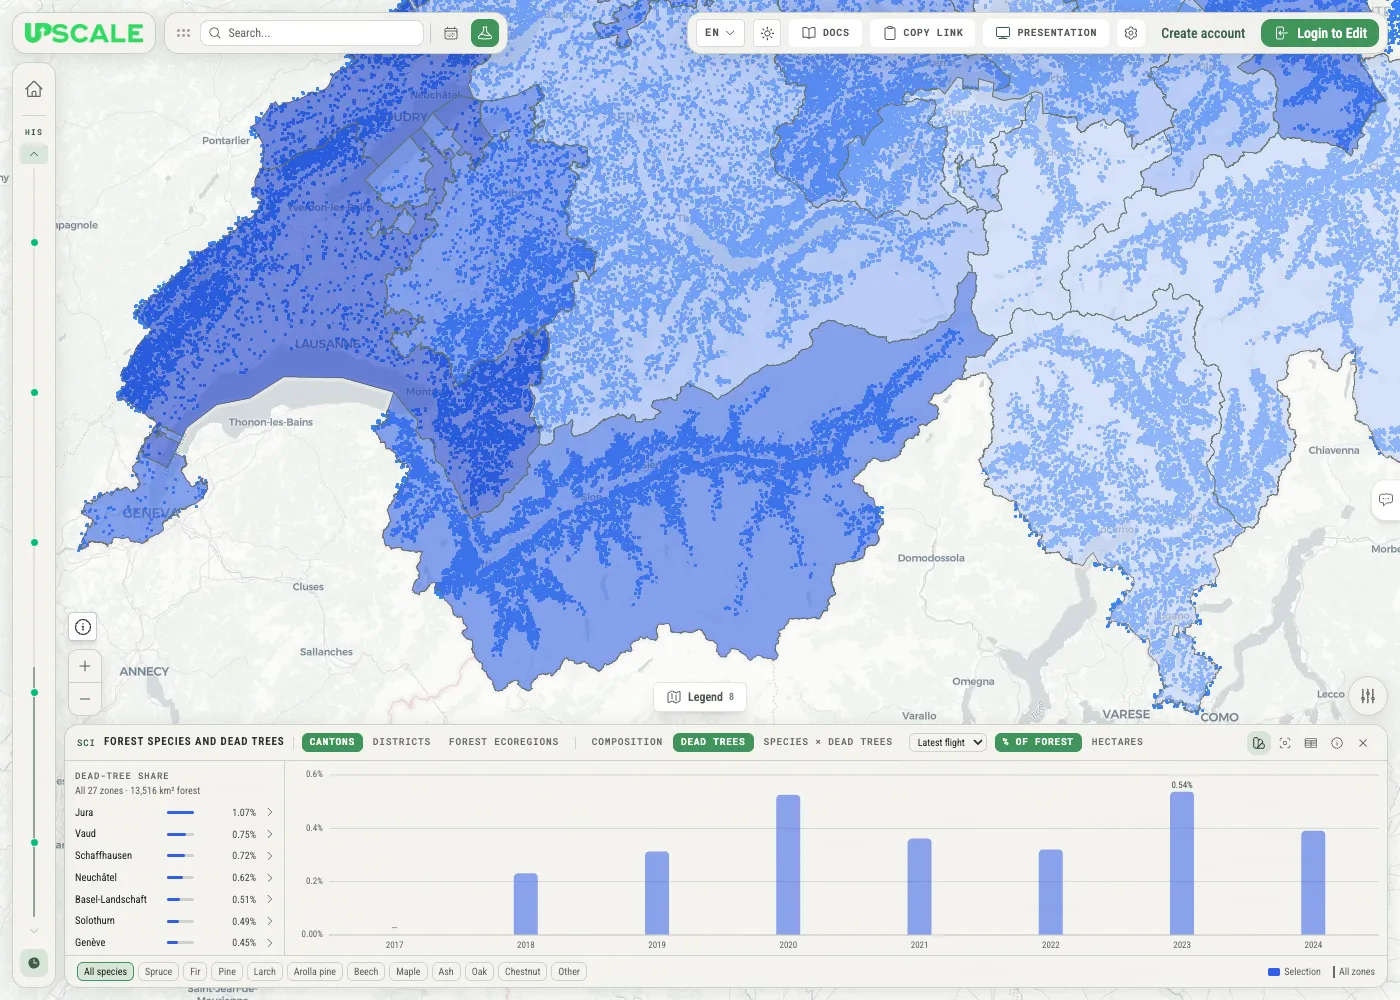
Section titled “Explore zones”In a room with a science dataset, the panel adds up two kinds of data per zone: a species map, which gives the probability of each tree species in every 30 m cell of forest, and the dead trees detected in each yearly flight. Pick a few zones and the panel shows which species make up their forest, how much of it was found dead in each flight, and which species carry more of the dead trees than their share of the forest. Everything is worked out in your browser from figures stored with the room, so any combination of zones answers instantly.
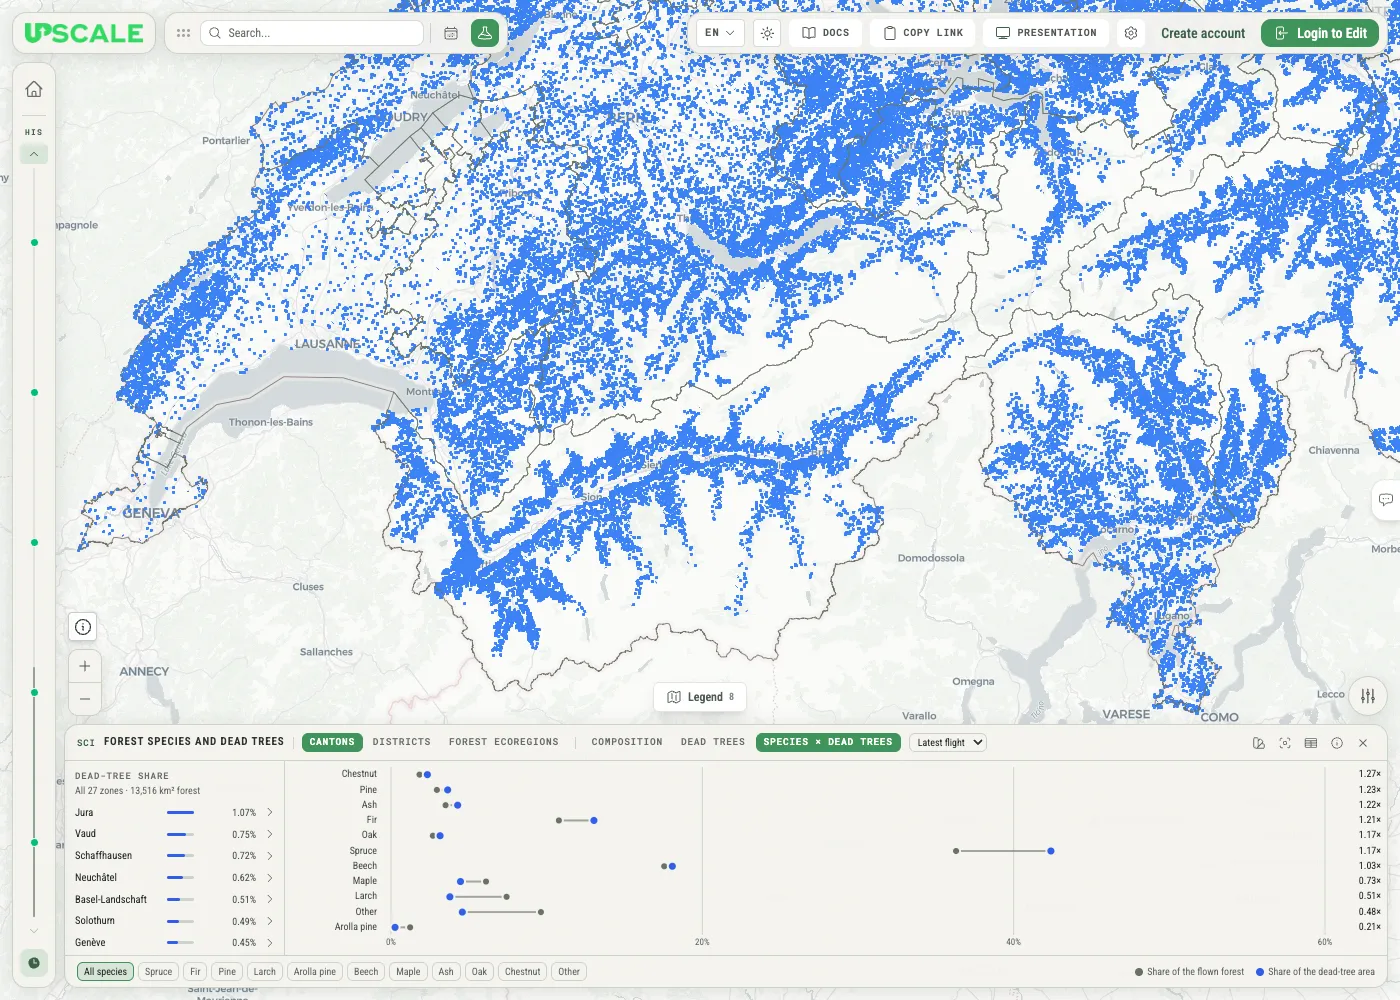
The dock has four parts:
- The header chooses what you look at: the zones (Cantons, Districts, Forest ecoregions), the view (Composition, Dead trees, Species × dead trees), and the flight, plus buttons for the map, the table, and the method note.
- The zone list on the left ranks the zones by the figure the current view is about.
- The chart on the right shows that view for the zones you selected — or for all of them.
- The species chips along the bottom focus on one species; the legend beside them explains the marks.
Pick your zones
Section titled “Pick your zones”The zone buttons in the header switch between Cantons, Districts, and Forest ecoregions. The zone list then ranks those zones by the current view’s figure, highest first; zones without a value come last.
- Click a zone to select it, and click more zones to add them. The figures of several zones are added together exactly, as if they were one area.
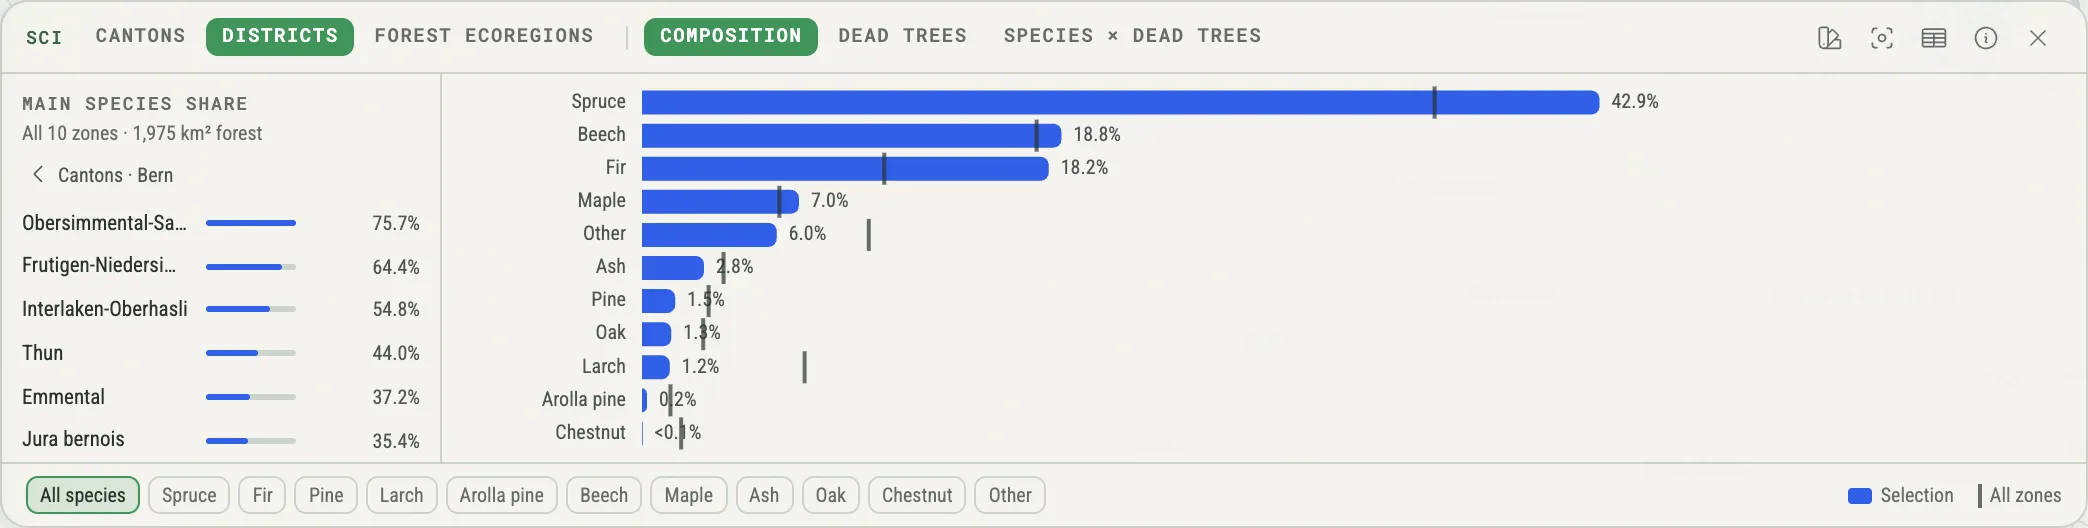
- The line under the list heading says what the figures cover — for example All 27 zones · 13,516 km² forest, or 2 zones selected.
- Clear goes back to all zones.
- The › arrow beside a canton opens its districts (Districts of Bern). The row at the top, ‹ Cantons · Bern, takes you back up, with that canton selected.
Three views
Section titled “Three views”Composition
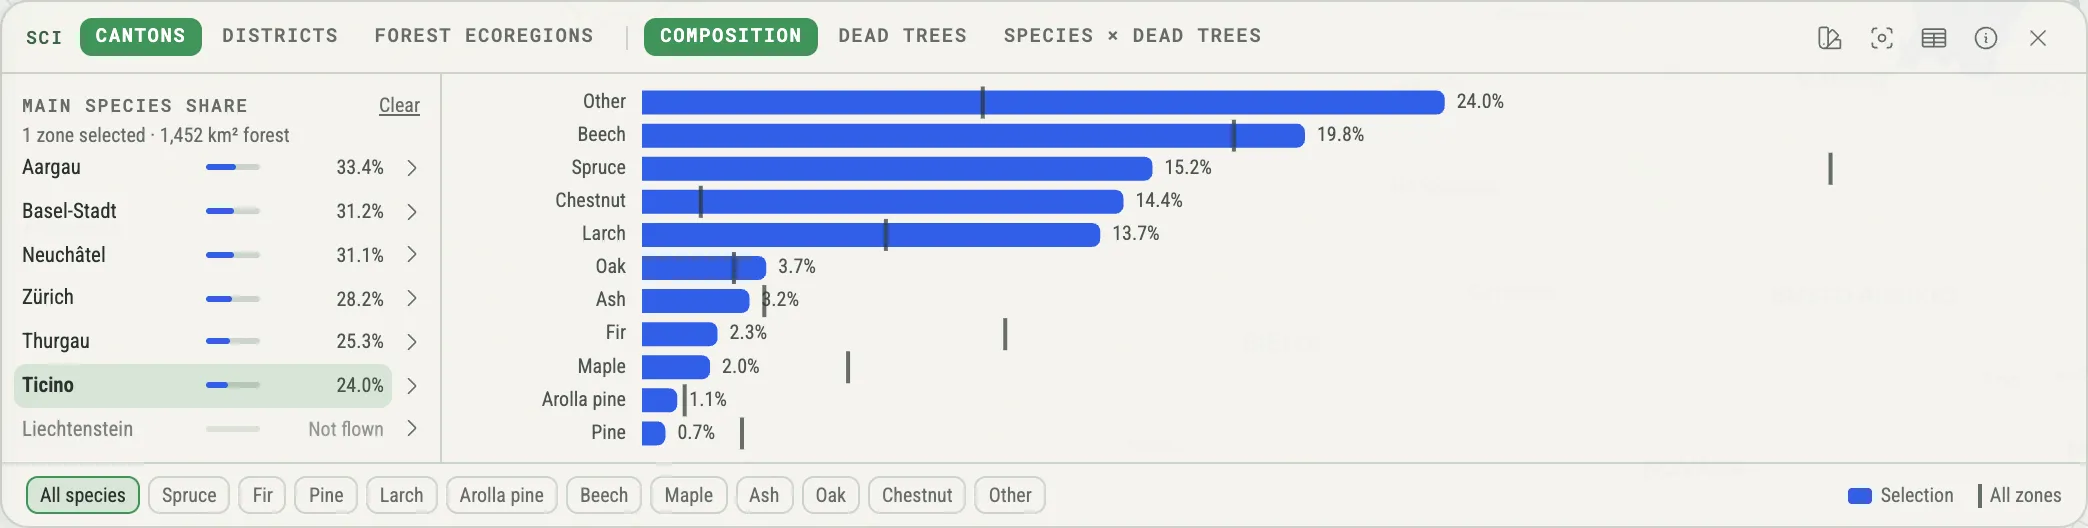
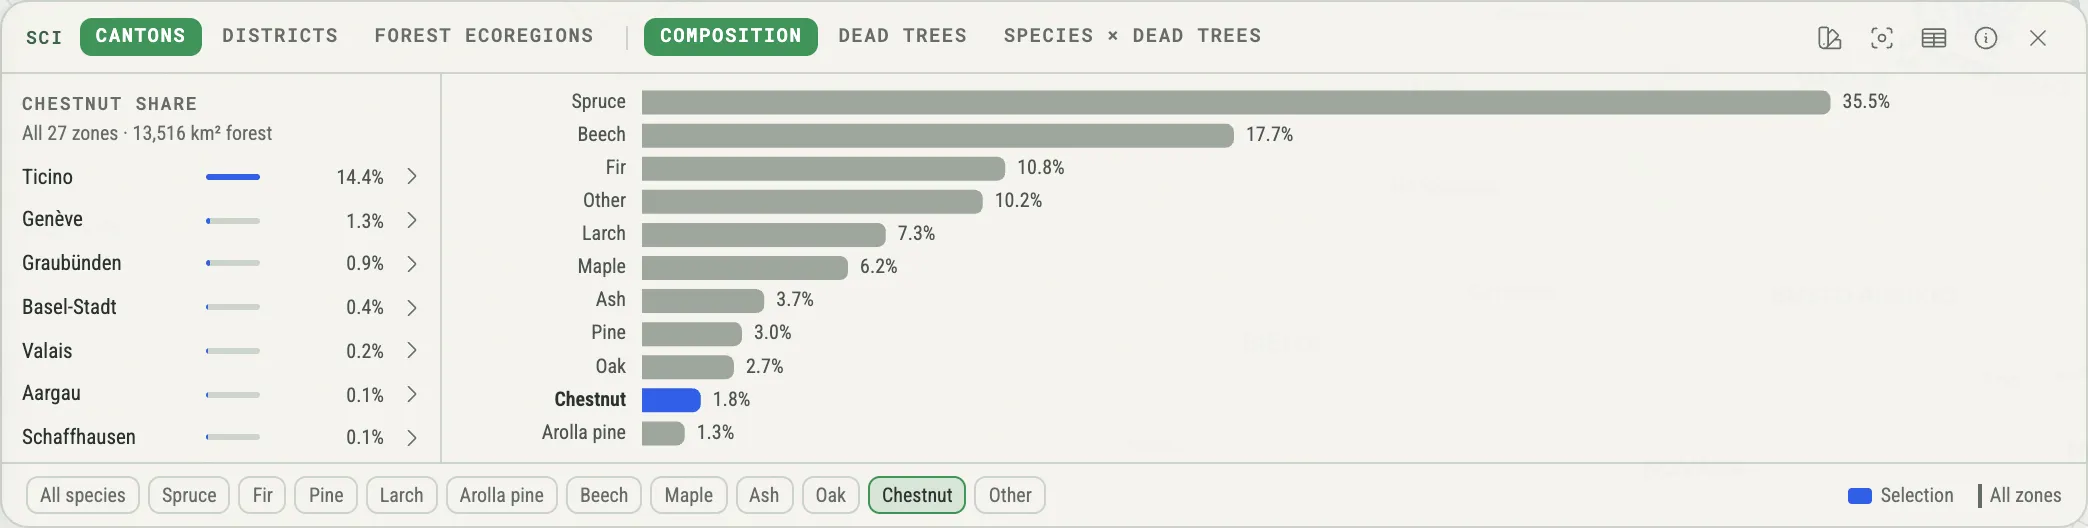
Section titled “Composition”Composition shows which tree species make up the forest of your selection: one bar per species, longest first, adding up to 100 %. Once you have selected zones (or opened a canton’s districts), a thin tick on each bar marks the same species across all zones, so you can see at a glance what is unusual about your selection.
Dead trees
Section titled “Dead trees”Dead trees shows one column per flight year: the area of the dead trees detected in that flight, as a share of the forest that flight covered. Switch the unit from % of forest to Hectares to see the area itself. Once you have selected zones, a tick on each column marks the same figure for all zones (in % of forest only).
A year without a column was not flown over your selection — that is a gap, not a zero. A paler column means that only part of the forest was flown that year. Hover over a column (or move to it with the keyboard) for the details: the share, the number of dead trees, and the figure for all zones.
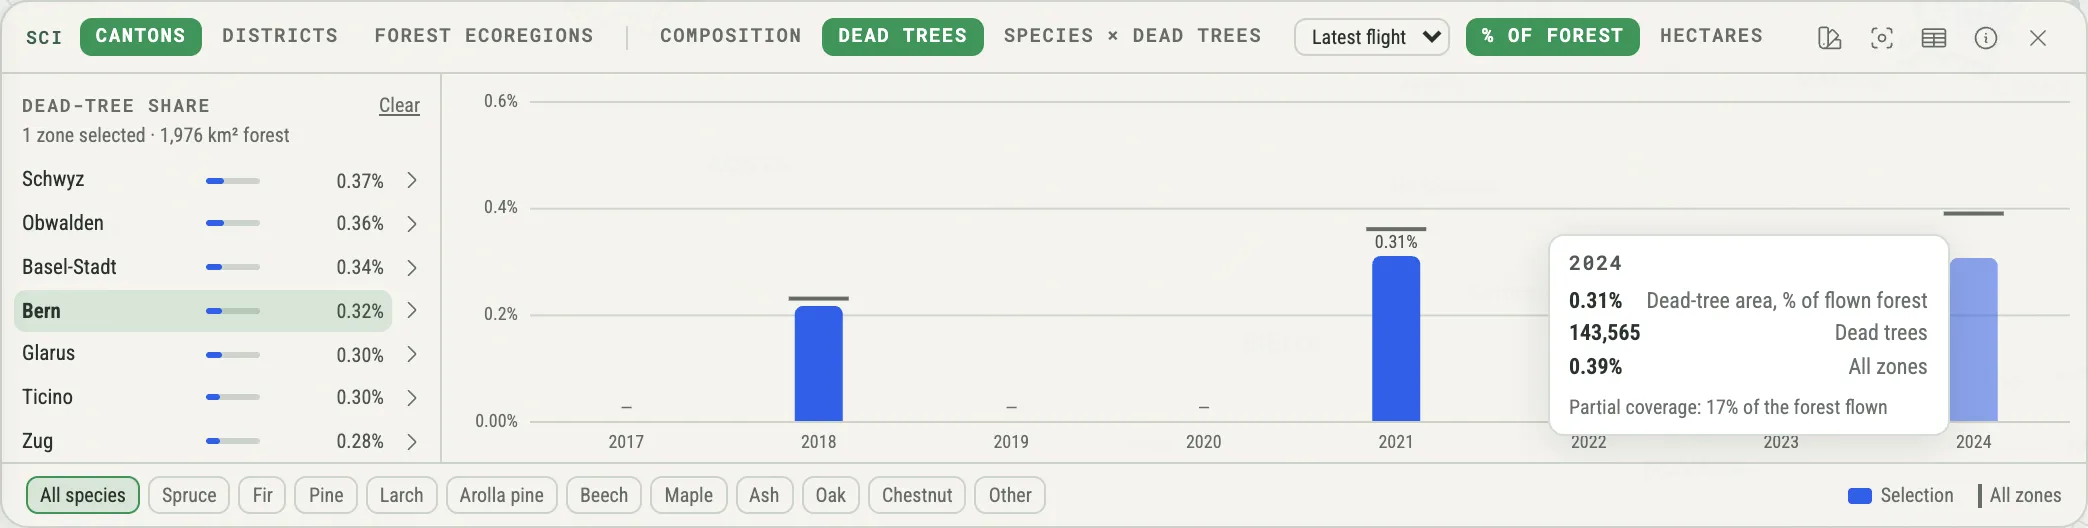
Click a column to choose that flight; click it again to go back to Latest flight.
Species × dead trees
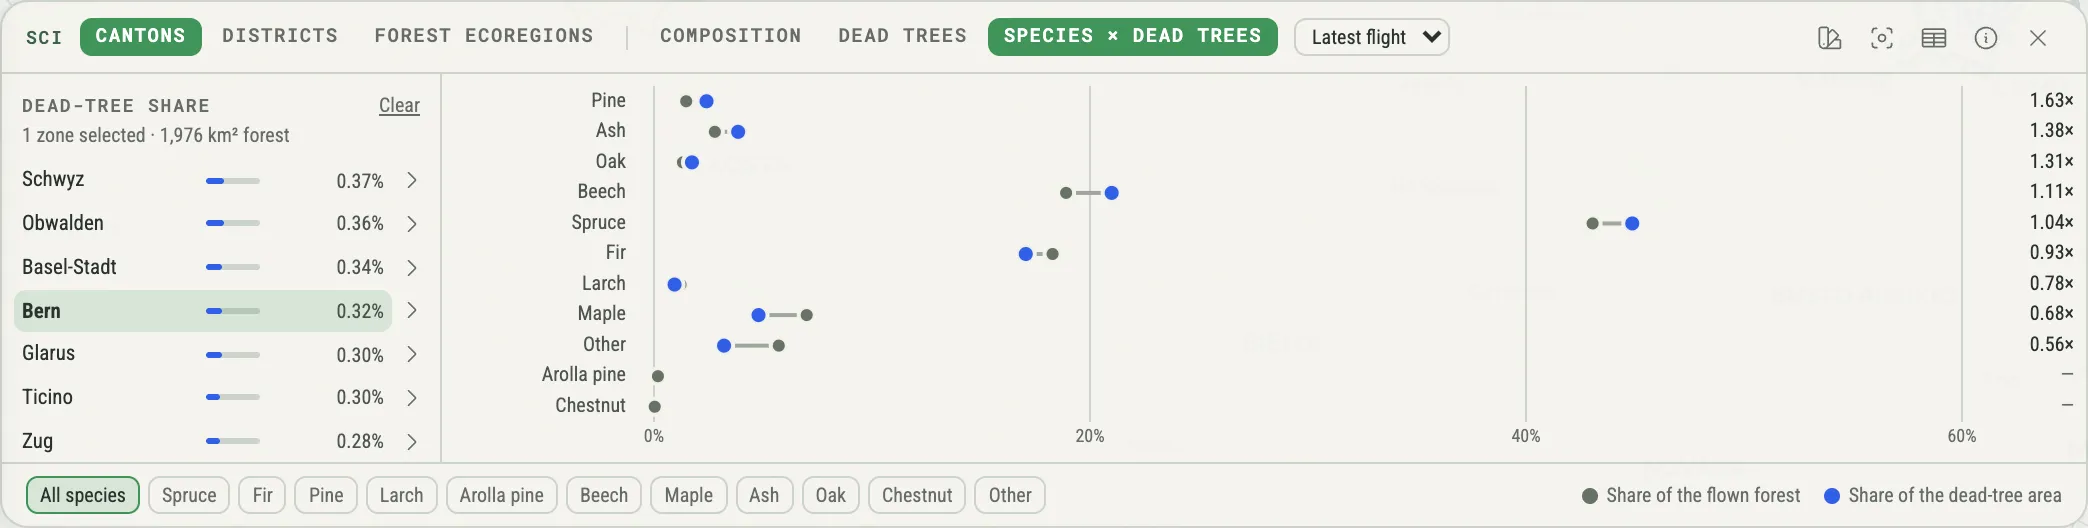
Section titled “Species × dead trees”Species × dead trees compares, for one flight, each species’ share of the flown forest (grey dot) with its share of the dead-tree area (blue dot). The ratio on the right divides the two: above 1× a species holds more of the dead-tree area than of the forest, below 1× less. The rows run from the most to the least over-represented species.
Choose a flight
Section titled “Choose a flight”Regions are flown in different years, so the Dead trees and Species × dead trees views have a flight menu in the header:
- Latest flight (the default) uses, for every 30 m cell, the most recent flight that covered it.
- A year shows that year’s flight only. Years that never covered your selection are greyed out.
The zone list follows the flight you choose. Flights are never added together: a standing dead tree seen in two flights would otherwise count twice.
Focus on one species
Section titled “Focus on one species”The chips along the bottom focus on a single species. Click one; click All species (or the same chip again) to go back.
- In Composition, the other bars turn grey and the zone list ranks the zones by that species’ share (Chestnut share).
- In Species × dead trees, the zone list shows that species’ ratio in each zone (Chestnut ratio).
- Dead trees is not broken down by species, so the chips do not change it.
You can also click a bar or a row in the chart to focus on its species.
Read it as a table
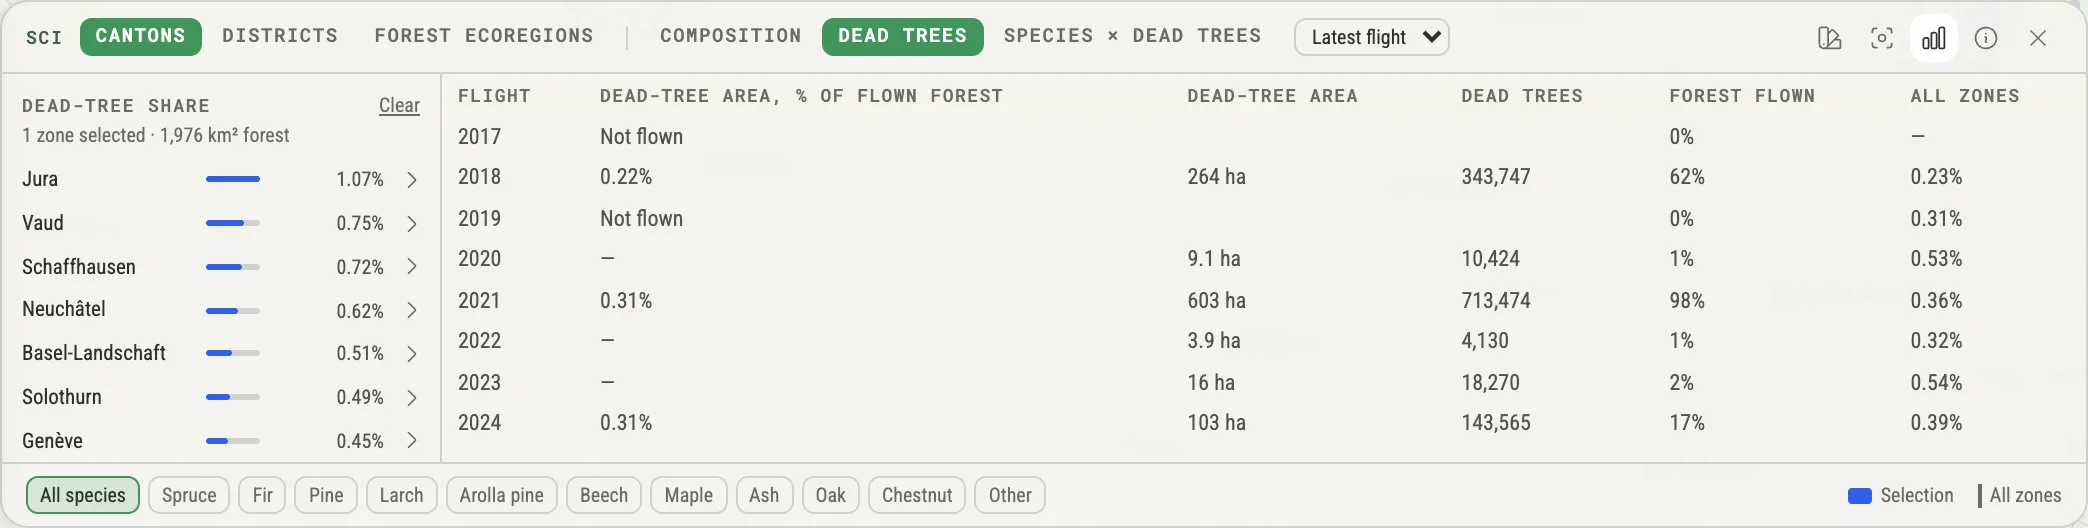
Section titled “Read it as a table”Show the table (the table button in the header) swaps the chart for a table with the same figures — easier to read exactly, to copy, and to use with a screen reader. Show the chart brings the chart back.
The panel and the map
Section titled “The panel and the map”While the panel is open, the map draws the zones of the current list:
- Outlines mark the zones in the list — only one canton’s districts once you have opened it.
- Hovering over a zone in the list highlights it on the map, and the other way round.
- Clicking a zone on the map selects or deselects it, exactly like clicking it in the list.
- Zoom to the selection (the viewfinder button) fits the map to your selected zones — or to all the zones in the list when nothing is selected — above the dock.
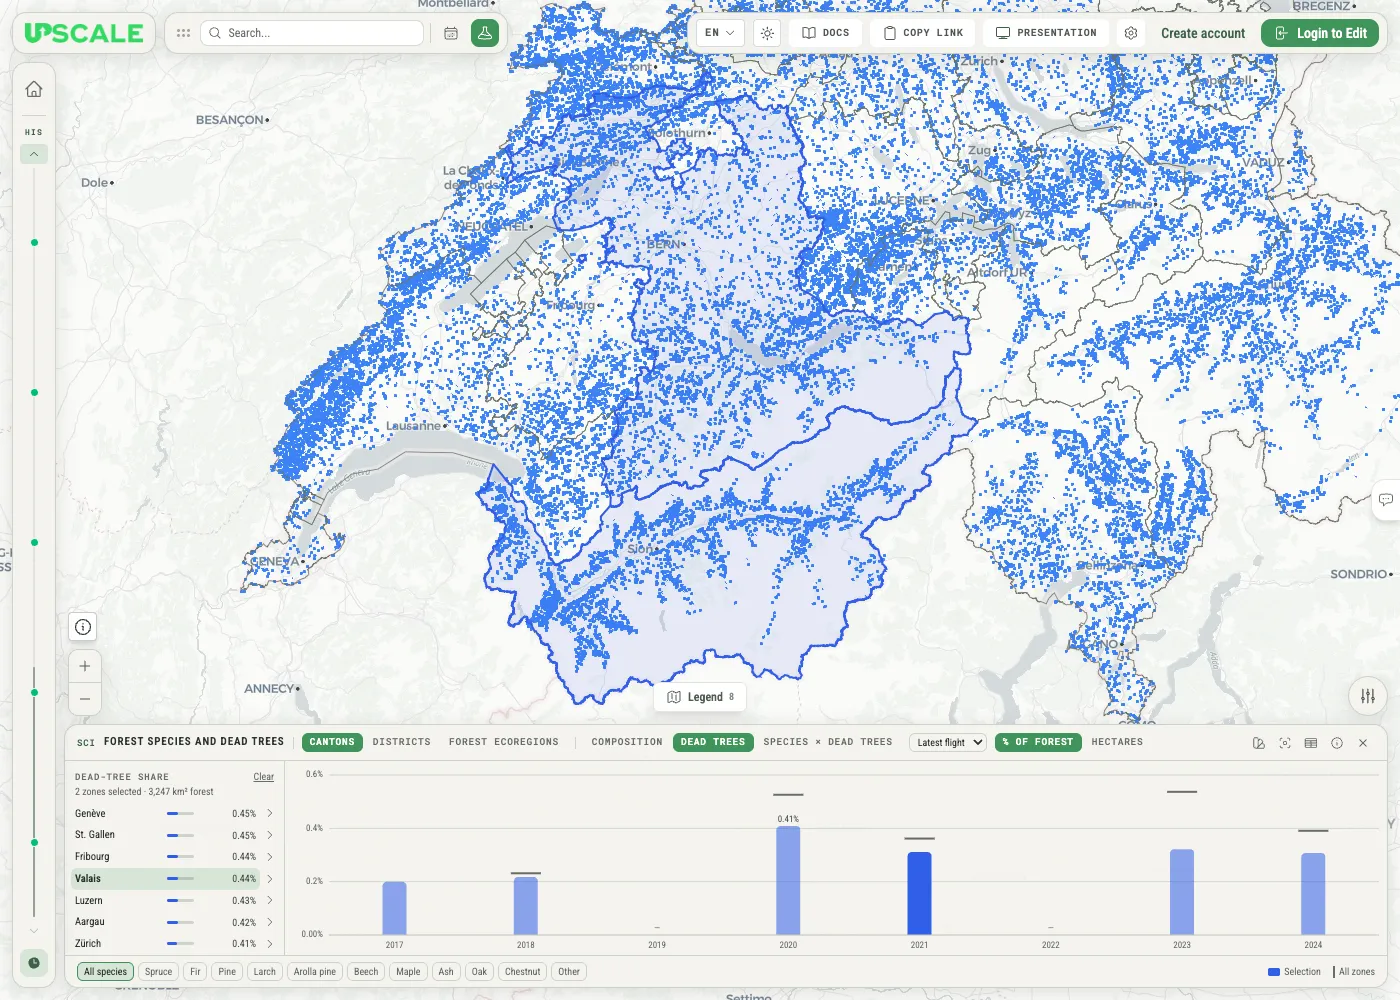
Colour the zones on the map (the palette button) shades each zone by its figure in the list, in up to five shades from light (low) to dark (high). Zones without a value stay uncoloured; the zone list gives the exact values.
What the numbers mean
Section titled “What the numbers mean”- Composition — each species’ share of the forest in the 30 m species map. A cell counts towards every species by its probability: a cell that is 70 % likely spruce and 30 % likely beech adds 0.7 of a cell to spruce and 0.3 to beech. The shares add up to 100 %.
- Dead-tree share — the area of the dead trees detected in one flight, divided by the area of the forest that flight covered. In the public room, the dead trees are the objects of its yearly Mortality layers.
- Ratio — each dead tree’s area is shared among the species by the probabilities of its 30 m cell. The ratio is a species’ share of that dead-tree area divided by its share of the flown forest: 1.2× means 20 % more than its share of the forest.
- All zones — the same figure for all the zones of the current zoning together, as a reference.
When a number is missing
Section titled “When a number is missing”The panel shows a gap rather than a figure it cannot back up:
- Not flown is not zero. If a flight did not cover your selection, its column is a dash and the table reads Not flown.
- Too little coverage. If less than 10 % of the selection’s forest was flown that year, the share is withheld — a dash, with the note Too little coverage. Between 10 % and 50 %, it is shown paler and marked Partial coverage, with the share of forest flown. In Species × dead trees, if the flight did not cover the selection, or covered too little of it, the note replaces the whole chart.
- Small species are withheld. A species’ ratio is withheld when the flown forest holds less than 50 ha of it, or when it makes up less than 0.5 % of that forest (Too little of this species in the flown forest). Withheld species come last. If a flight found no dead trees at all in your selection, the ratios are dashes, with the note No dead trees detected.
- Coverage is inferred. The data does not record which forest a flight covered. It is taken to be the 1 km tiles with at least one detected dead tree that year, so a flown tile in which nothing was detected counts as not flown.
The table’s Forest flown column shows how much of the selection’s forest each flight covered.
How to read, and the sources
Section titled “How to read, and the sources”How to read (the ⓘ button) opens a short note on each view and on how flight coverage is inferred, followed by the exact sources behind the figures — each file with the start of its SHA-256 fingerprint — and the date the dataset was built.
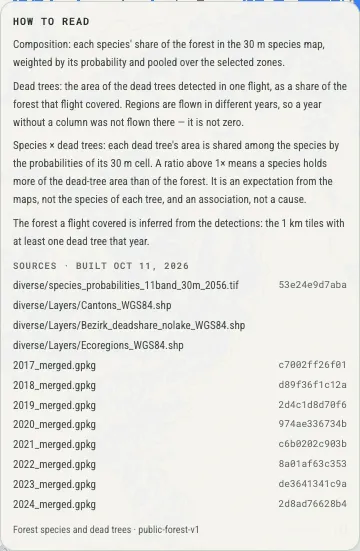
The note opens below the top bar and scrolls when it is longer than the space above the panel. Press Escape or click outside it to close it.
Owners and editors can rewrite the note’s text — to add credits, for example — with Edit text. Each language has its own text: you edit the one for the language you are using, starting from what it shows now, with a preview and the formatting of rich marker descriptions. Use the built-in text brings back the standard explanation for that language, and languages nobody has edited keep it. The sources below the text always come from the dataset.
Who can use it
Section titled “Who can use it”| Role | Explore the panel | Set it up | Write the note |
|---|---|---|---|
| Owner | ✔ | ✔ | ✔ |
| Editor | ✔ | ✔ | ✔ |
| Viewer | ✔ | — | — |
| Public viewer | ✔ (public rooms) | — | — |
Everything you do in the panel is yours alone. Your picked point, zones, view, measure, flight, species, table, and map colours are not saved to the room, nobody else sees them, and they reset when you reload the page. In a public room, you can explore the panel without signing in.
Owners and editors set the panel up:
- a Science configuration, loaded in Room settings: see Configure the Science Panel;
- or a science dataset, with its zonings linked to map layers and the view the panel opens with: see Create a Science Dataset.
A configuration brings its own explanation for How to read. Write the note applies to a science dataset. The panel is not shown in Presentation mode.