

Rich Marker Descriptions
A marker description can be more than a paragraph of text. Write a small set of HTML tags in the description box and the marker’s popup renders them: headings, bold and italic, inline code, lists, links, tables, and an embedded line chart.
Plain text still works exactly as before — if you don’t use any tags, nothing changes.
Formatting, lists, and links
Section titled “Formatting, lists, and links”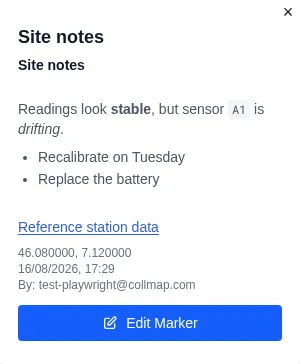
That popup came from this description:
<h2>Site notes</h2>Readings look <b>stable</b>, but sensor <code>A1</code> is <i>drifting</i>.<ul><li>Recalibrate on Tuesday</li><li>Replace the battery</li></ul><a href="https://www.swisstopo.admin.ch">Reference station data</a>Tags you can use
Section titled “Tags you can use”| Purpose | Tags |
|---|---|
| Emphasis | <b> <strong> <i> <em> <u> |
| Code | <code> |
| Headings | <h1> <h2> <h3> |
| Lists | <ul> <ol> <li> |
| Paragraphs & breaks | <p> <br> <hr> |
| Links | <a href="https://…"> |
| Tables | <table> <tr> <th> <td> (<thead>/<tbody> optional) |
| Charts | <chart> — see below |
Blank lines start a new paragraph and single line breaks are kept, so you can write ordinary text and reach for a tag only where you need one.
Add a table
Section titled “Add a table”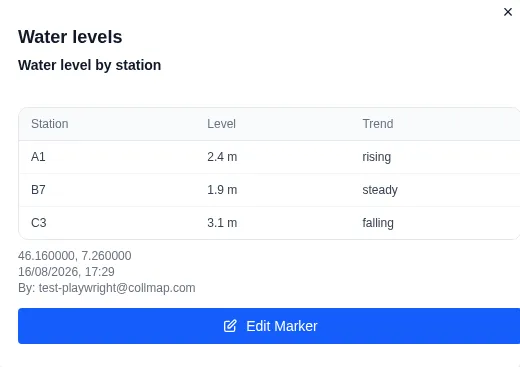
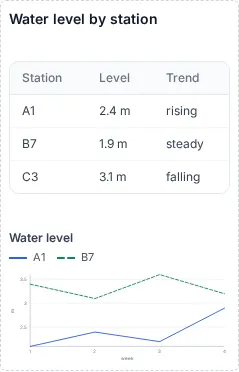
<h3>Water level by station</h3><table><tr><th>Station</th><th>Level</th><th>Trend</th></tr><tr><td>A1</td><td>2.4 m</td><td>rising</td></tr><tr><td>B7</td><td>1.9 m</td><td>steady</td></tr><tr><td>C3</td><td>3.1 m</td><td>falling</td></tr></table>A first row made entirely of <th> cells becomes the header. You don’t need <thead> or <tbody> —
they’re added for you. A marker with a table gets a wider popup, and a very wide table scrolls
sideways inside it.
Table text is searchable: the Markers panel finds a marker by a value that appears only inside a cell.
Add a line chart
Section titled “Add a line chart”Put a <chart> tag in the description with its data as JSON inside.
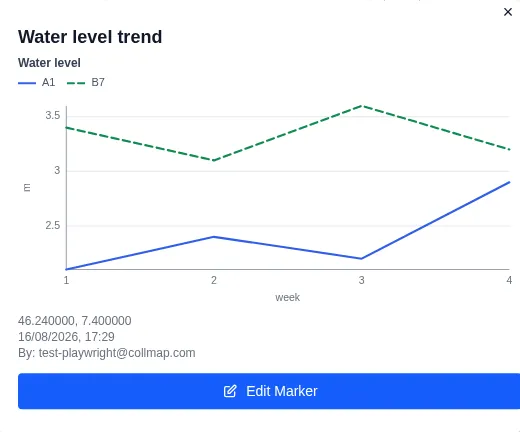
<chart>{ "v": 1, "type": "line", "title": "Water level", "xLabel": "week", "yLabel": "m", "series": [ { "label": "A1", "points": [[1, 2.1], [2, 2.4], [3, 2.2], [4, 2.9]] }, { "label": "B7", "points": [[1, 3.4], [2, 3.1], [3, 3.6], [4, 3.2]] } ]}</chart>Each entry in series is one line. points is a list of [x, y] pairs — they don’t need to be in
order. title, xLabel, yLabel, and each series label are optional; a label is worth adding
when you have more than one line, because it names the line in the legend.
| Field | Notes |
|---|---|
v |
Always 1. |
type |
Always "line". |
series |
1–4 series, up to 1,000 points in total. |
label |
Series name, shown in the legend. |
color |
Optional hex colour, e.g. "#315ee7". Leave it out to use the built-in palette. |
Each line gets its own colour and its own dash pattern, so the lines stay tellable apart when printed in black and white or read by someone with colour-vision deficiency.
Preview while you write
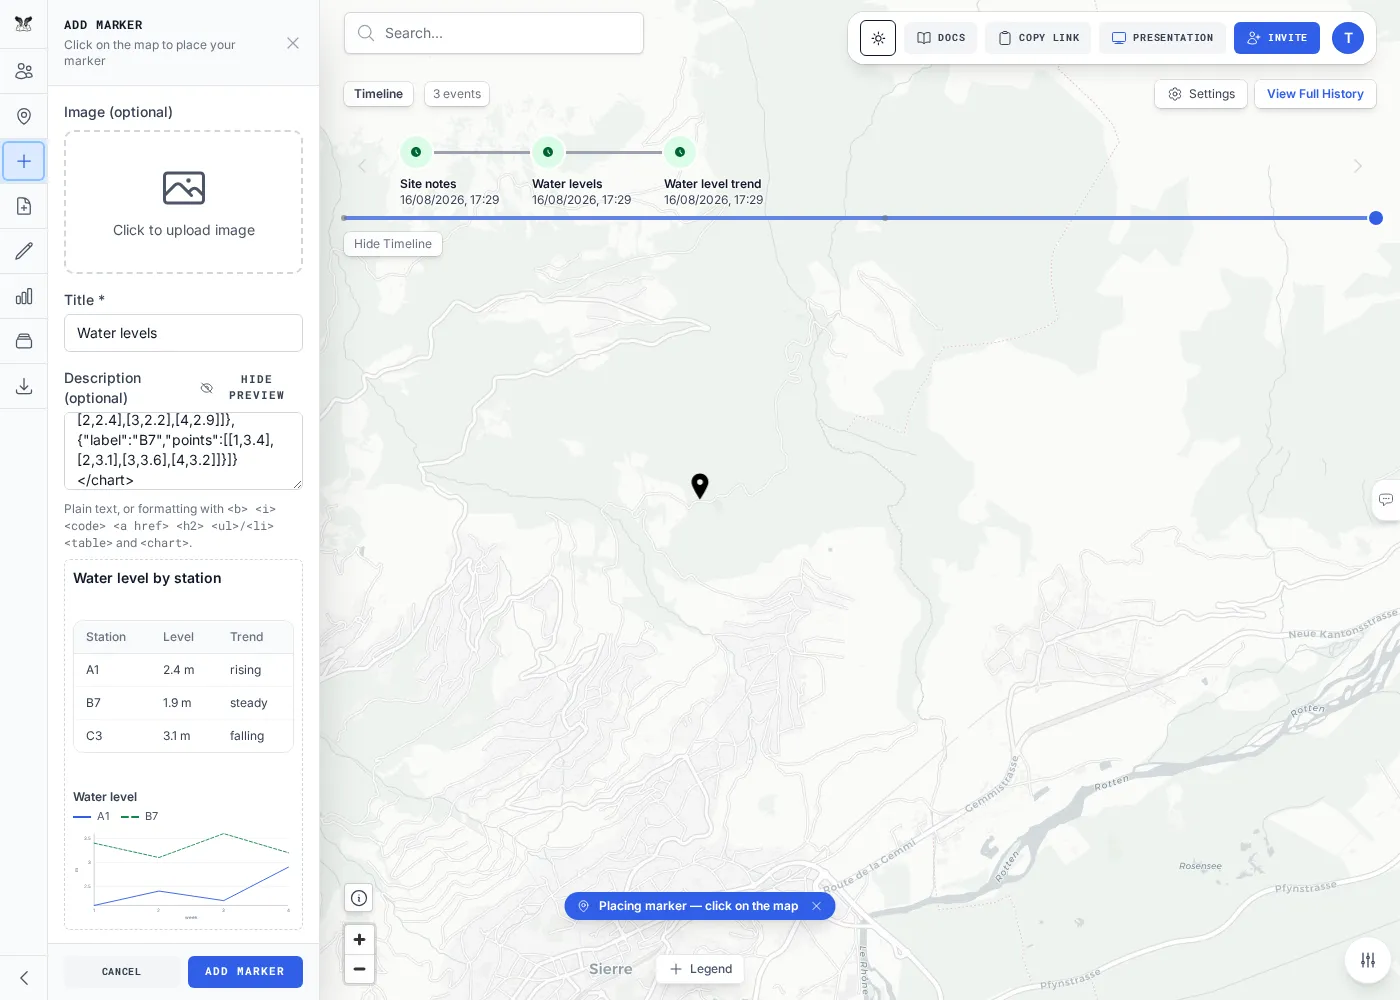
Section titled “Preview while you write”Authoring a table or a chart’s JSON blind is no fun, so the description box has a Preview toggle. It renders exactly what the popup will show.
-
Type your description in the Add Marker or Edit Marker panel.
-
Click Preview above the box.
-
The rendered result appears underneath. Keep editing — it updates as you type.
Good to know
Section titled “Good to know”- Everywhere else shows plain text. The markers list, presentation callouts, the history view, and exported files show a readable text version of your description. Only the map popup renders the formatting.
- Descriptions are shared. Everyone in the room — and anyone viewing a public room — sees what you write, so it renders the same for them as it does for you.
- There’s a size limit. A description can be up to 20,000 characters. The box tells you when you’re close, and a description past the limit falls back to plain text.
- Exports keep your formatting. Export a room and re-import it and the rich description comes back exactly as written.