

The Room Interface
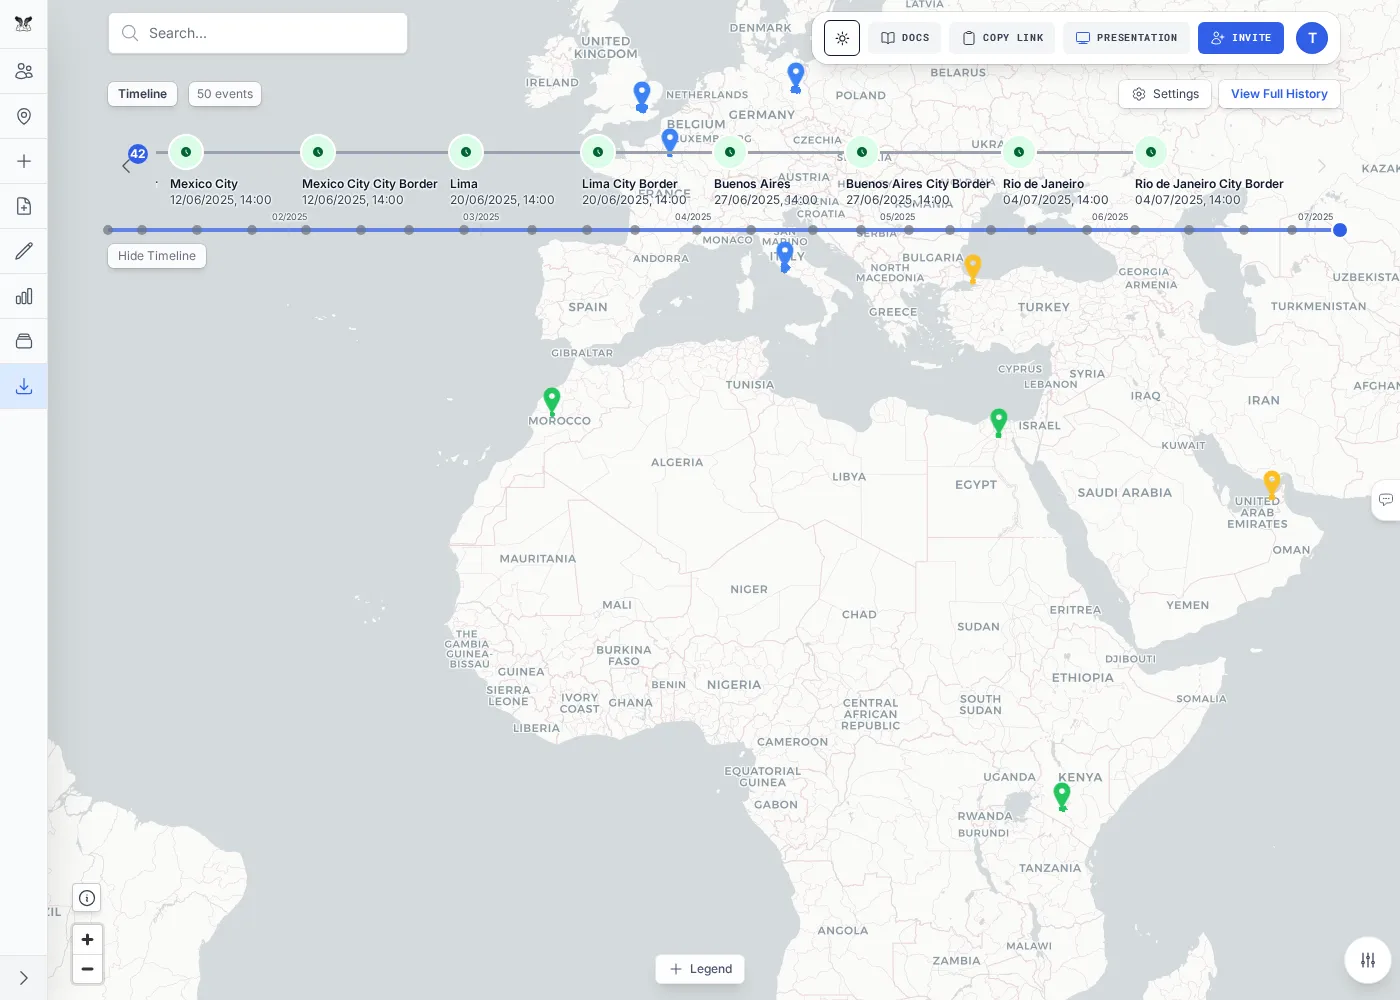
Inside a room, the map fills the screen and everything else sits around its edges: the icon rail on the left, the navbar across the top, floating controls at the corners, the timeline overlay, and the legend.
The left icon rail
Section titled “The left icon rail”The rail on the left is the main toolbox. Each icon opens a panel; click it again to collapse. From top to bottom:

| Tab | What it does |
|---|---|
| Menu | Room name (editable by the owner) and room-level settings. |
| Members | Who’s in the room and their roles; invite or remove people (owner). |
| Markers | A searchable list of every marker; click one to fly to it. |
| Add Marker | A form to place a marker (you can also just click the map). |
| Upload Layer | Bring in GeoJSON, Shapefile, GeoPackage, or GeoTIFF files. |
| Draw | Draw polygons, rectangles, circles, and polylines. |
| Report | Run coverage / distribution analysis over a drawn shape. |
| Layers | Manage uploaded layers — visibility, style, colormap, delete. |
| Export / Import | Export the whole room as a GeoPackage, or import one. |
The tabs have their own guides: Markers & Drawing, Uploading files, and Export & Import.
The top navbar
Section titled “The top navbar”Across the top of a room:
- Room name — click to rename (owner).
- Search — find a place and fly the map to it.
- Theme toggle — light / dark.
- Copy Link — copy the room’s share URL.
- Presentation — open the room as a slideshow.
- Invite — invite collaborators (owner).

Floating map controls
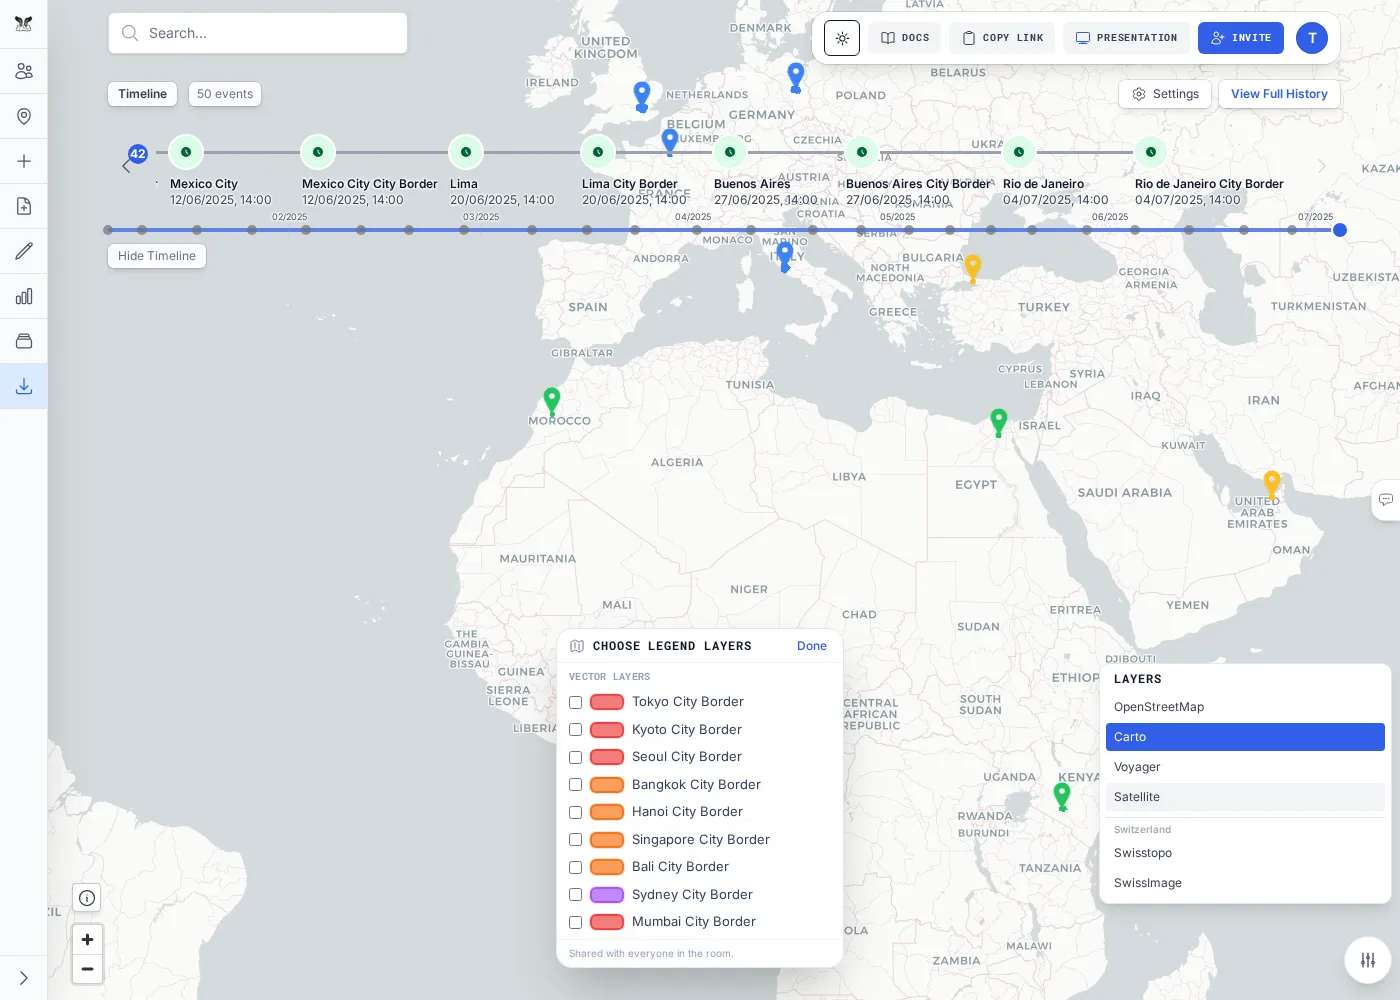
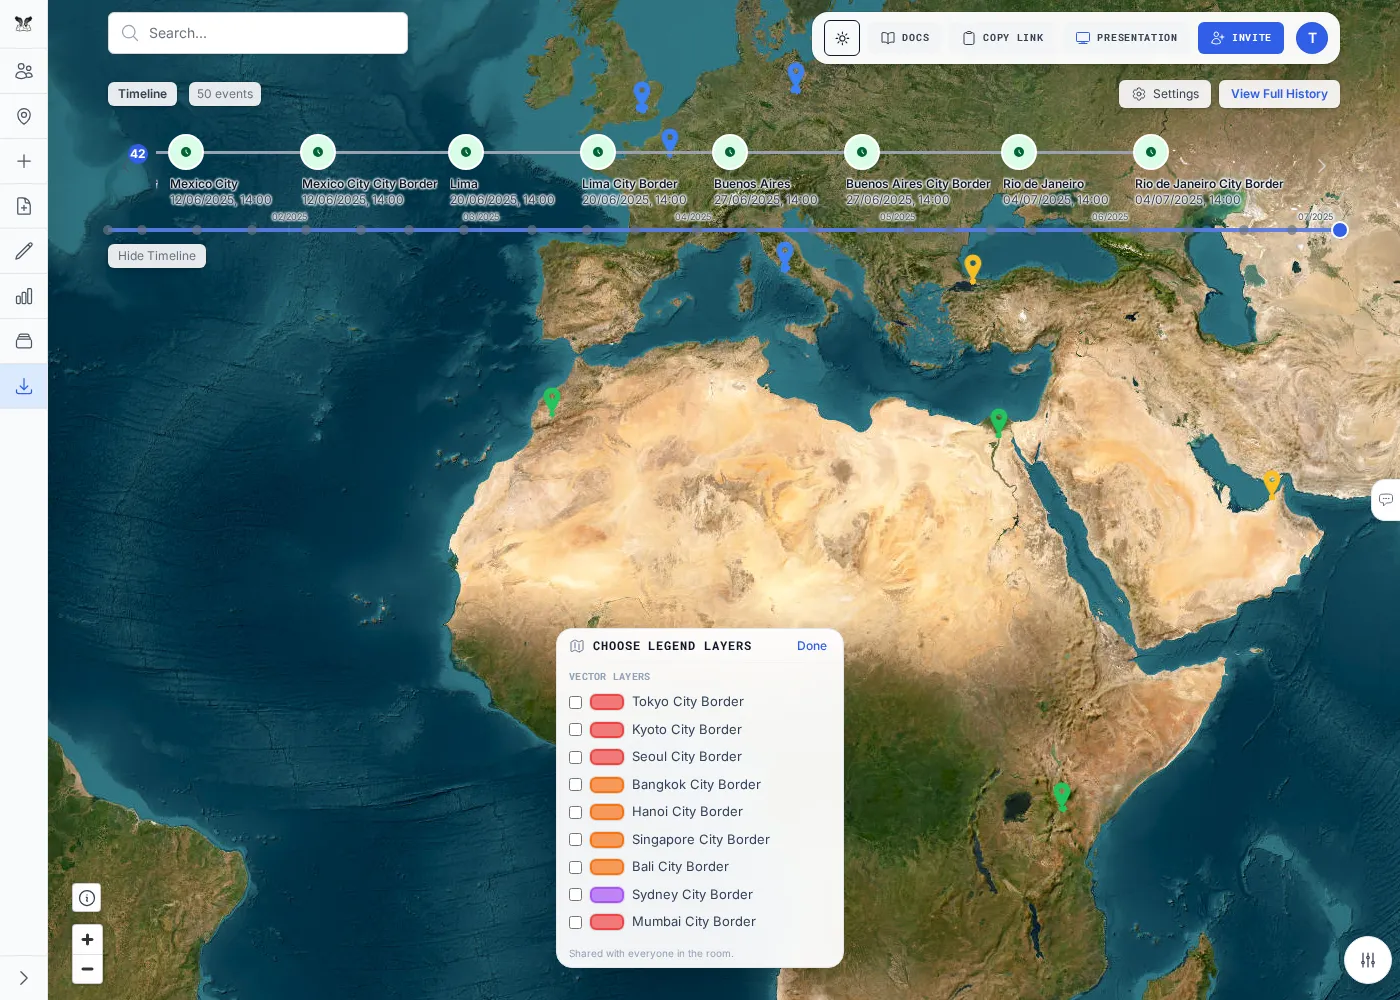
Section titled “Floating map controls”At the map’s corner is a cluster of controls for the map itself: fullscreen, locate me (jump to your location), a search toggle, and a layers toggle that opens the base-layer picker — where you switch the background map between OpenStreetMap, Carto, satellite imagery, Swisstopo, and more.
The timeline
Section titled “The timeline”If the room’s markers, layers, or events have dates, a timeline overlay appears across the top of the map. Scrub it to move through time, filter what’s shown, and let the map auto-zoom to each period. The full change history lives on its own page — see History & Presentation.
The legend
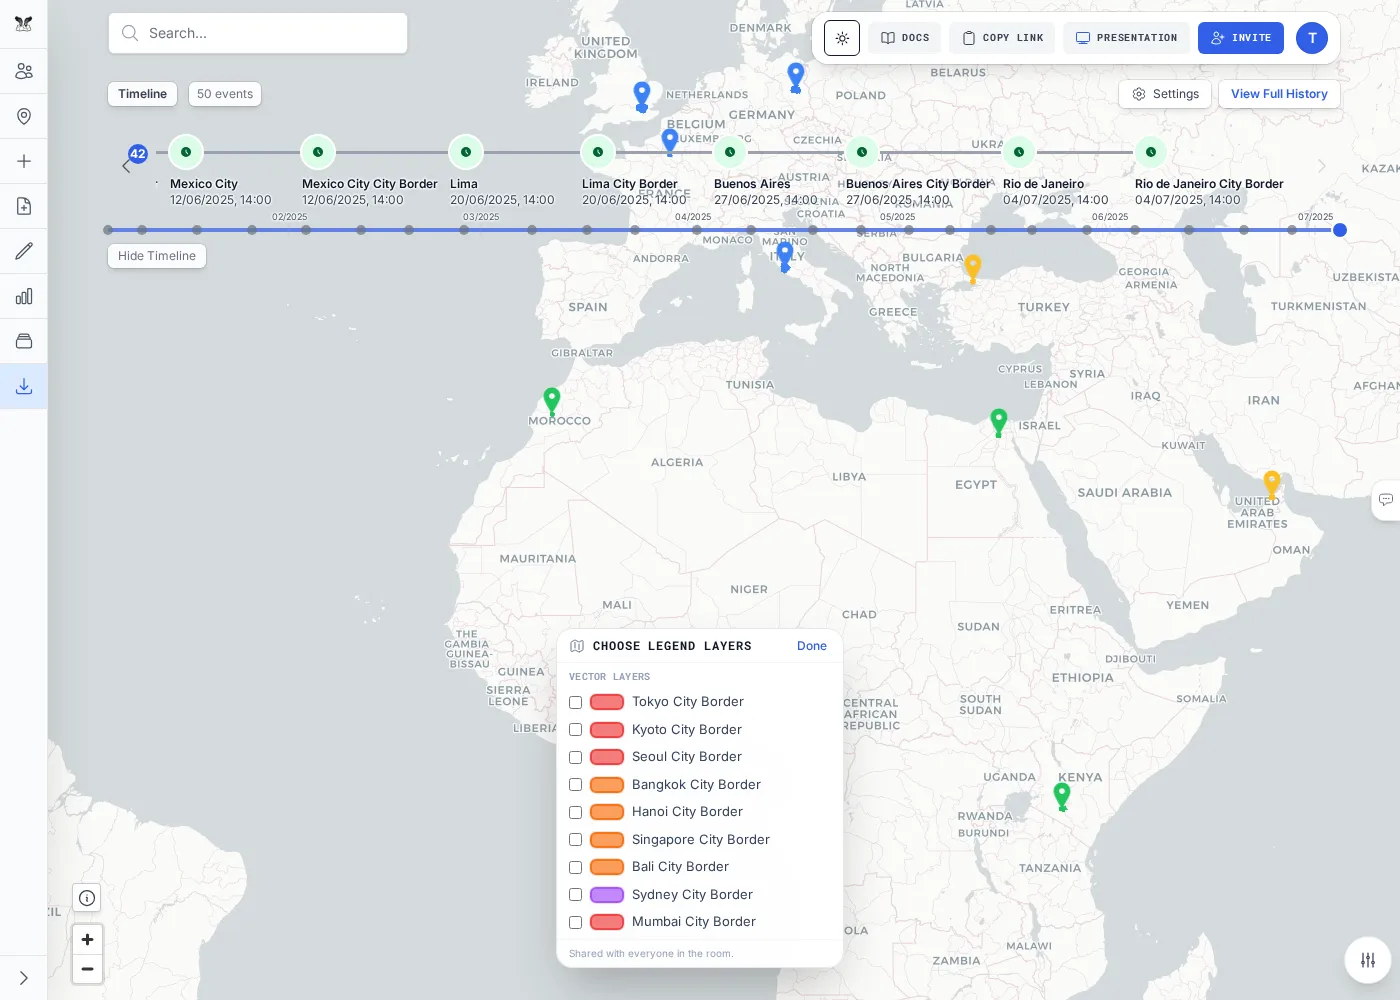
Section titled “The legend”The legend panel summarizes what’s on the map — the symbol and color for each marker group and layer, plus the color ramp for any raster. Owners and editors can curate it (labels, order, which entries show).
Comments
Section titled “Comments”Editors and owners can leave comments pinned to points on the map — useful for review and discussion without changing the data itself.